Closed
Issue #3
· created by  (Edited
)
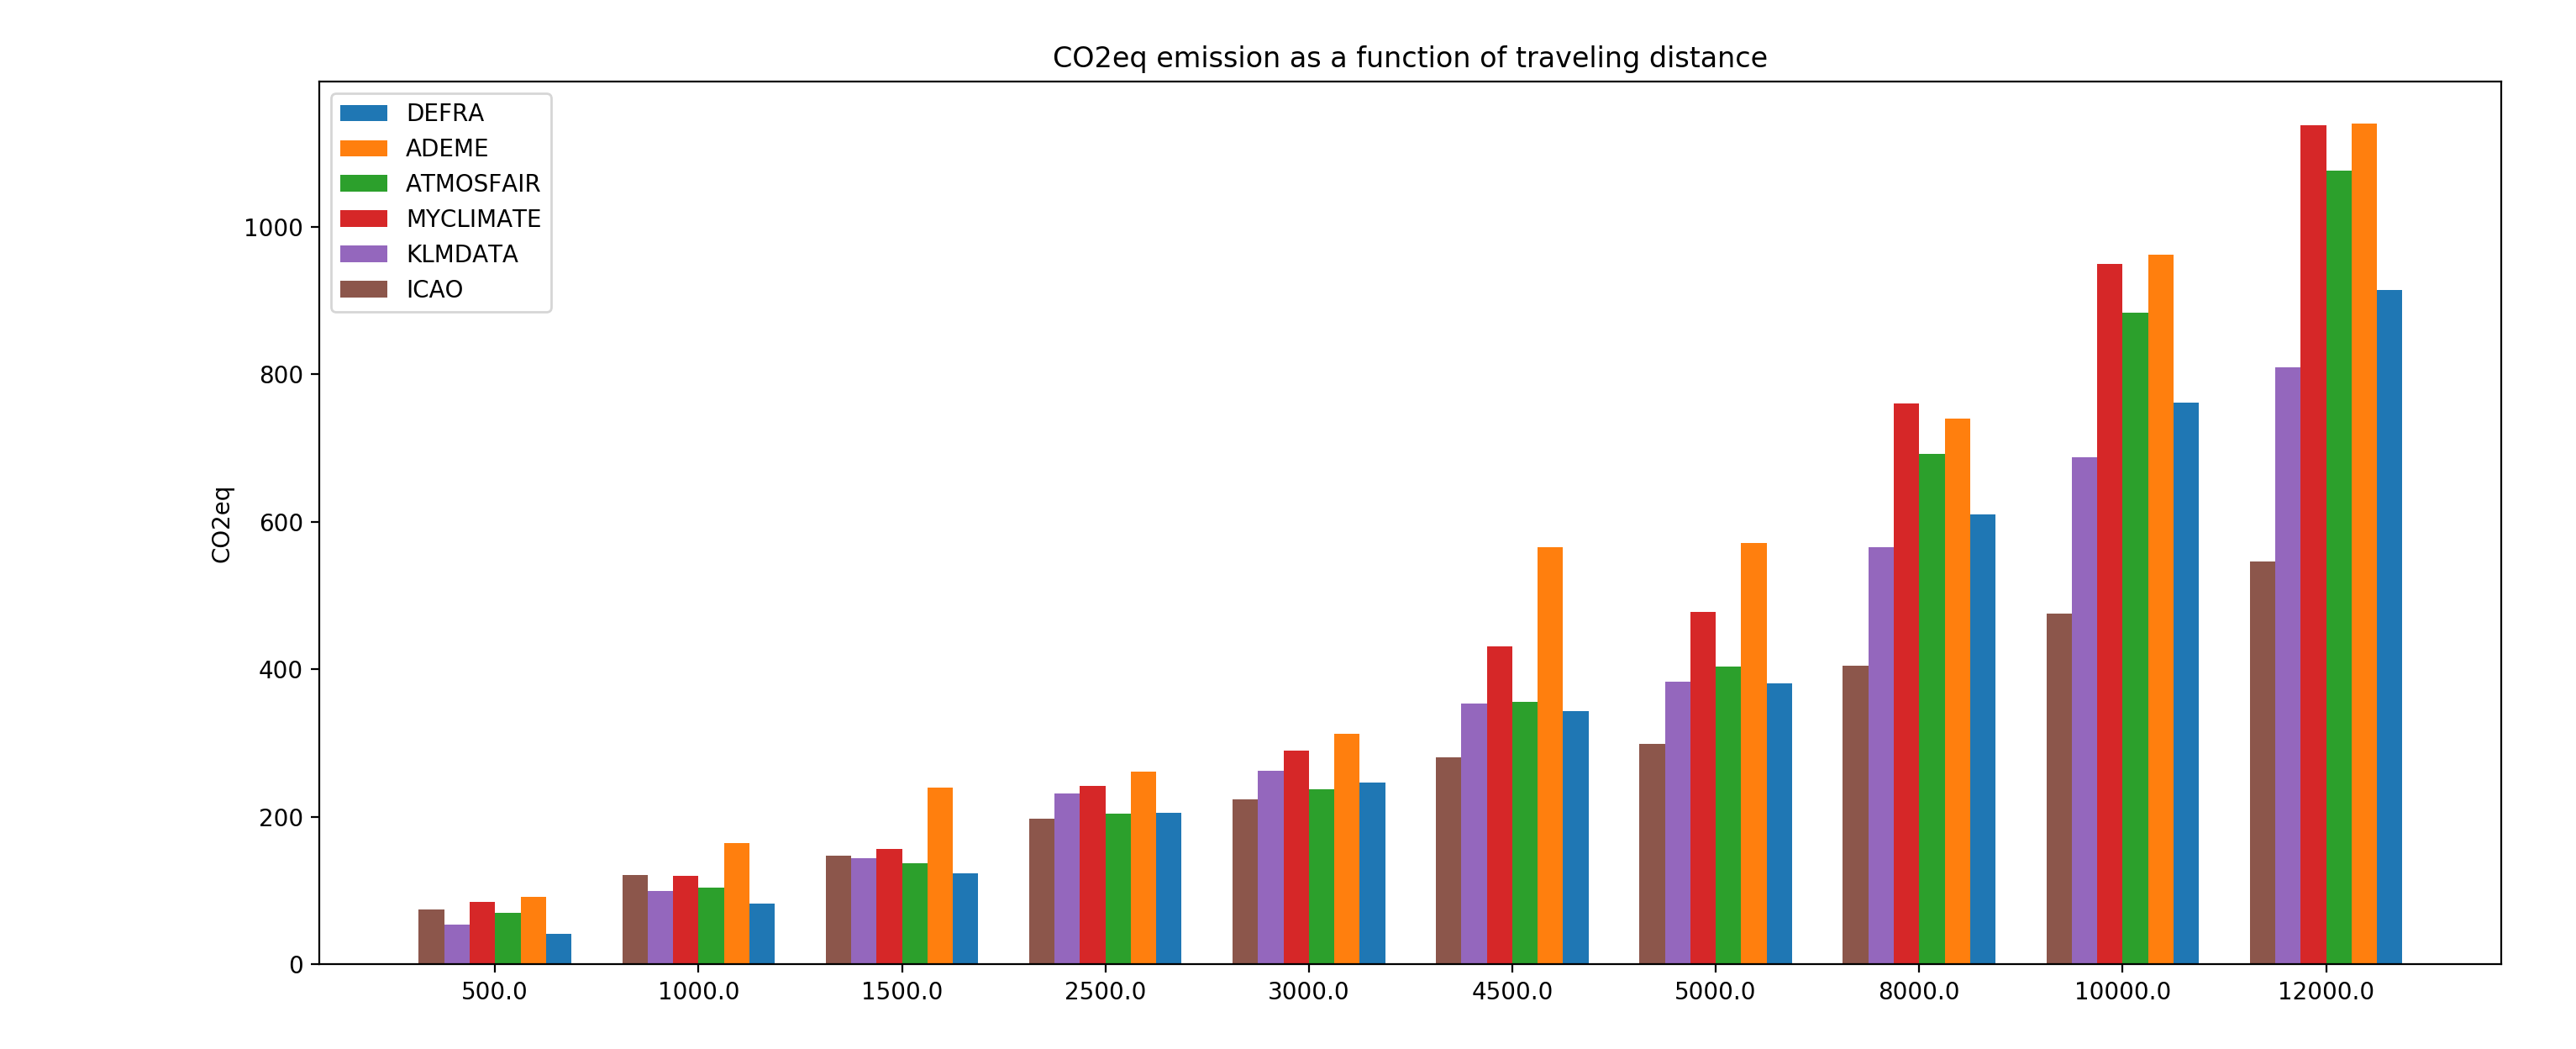
Plot scaling laws for each model
@dbarret provided:
methods=["DEFRA","ADEME","ATMOSFAIR","MYCLIMATE","KLMDATA","ICAO"]
gcd_arr=[500.,1000.,1500.,2500.,3000.,4500.,5000.,8000.,10000.,12000.]
db_my_climate(gcd_arr[0],M=2,CW=[0.96,0.80],verbose=1)

labels = gcd_arr
x = np.arange(len(labels))  # the label locations
width = 0.75  # the width of the bars
fig, ax = plt.subplots()

dist_min=500.
ce=[]
for d in gcd_arr :
    print "----------------------------------------------"
    for m in methods :
        print "Distance=",d,m,db_direct_emission(m,np.min(gcd_arr),d)
        ce.append(db_direct_emission(m,np.min(gcd_arr),d))


print ce
for j in range(0,6):
    val=[]
    for i in range(0,len(ce)-1,6):
        print i+j,ce[i+j]
        val.append(ce[i+j])
    rects1 = ax.bar(x - j*width/len(methods)+width/2.-width/len(methods)/2., val, width/len(methods), label=methods[j])

ax.set_ylabel('CO2eq')
ax.set_title('CO2eq emission as a function of traveling distance')
ax.set_xticks(x)
ax.set_xticklabels(labels)
ax.legend()

fig.tight_layout()

plt.show()
which generates

-
Status changed to closed